REST API Request Profiling and Performance Analysis in Highly Concurrent Environments
Abstract
Load testing is part of performance testing. It is designed to check how the system behaves under concurrent load of virtual users. Here we can specify some metrics that describe how the system is performing. For a REST API, it will give us a general idea of average response times of called endpoints. The tricky part of load testing is to get information about bottlenecks. Additional profiling and monitoring tools are required to run different kinds of tests, to know the cause of potential problems in database, code, hardware or network layer. However, load tests should answer the question of whether the system can handle the desired load and how it can scale. There are different tools that can be used to create load tests. JMeter and SoapUI are the most popular. In this experiment, I used a tool called Gatling. In Gatling, tests are written in Scala DSL. It uses Akka actors to be able to efficiently execute the prepared simulation and scale it to the desired load. It also uses the concept of session to maintain state between calls.
Experiments
The test setup was fairly simple. The APIs we wanted to test were hosted in a server with a setup that closely mimicked our production environment. This is important because otherwise the insights derived from the experiment will not be much helpful if it doesn’t resemble production environment. Next thing is to create a setup. A setup in Gatling is called a simulation. Extending Simulation class will give us access to tools needed to set up and execute tests. It will allow us to define actions, virtual users and the scenario that will be executed. At first we have to build a scenario like the following:
val scn: ScenarioBuilder = scenario("Initial Scenario")
  .exec(http("Get all users")
  .get("/users"))
Next we will have to configure the protocol via which the API endpoints will be invoked
val httpConf = http
  .baseURL(“https://sample-api-server.com“)
  .acceptHeader("application/json")
With scenario and protocol defined, we can set up the simulation.
setUp(
  scn.inject(atOnceUsers(1))
).protocols(httpConf)
Next is to run the simulations using the following command:
./bin/gatling.sh -s com.pragmatists.gatling.InitialSimulation
Gatling will run and should produce a report that will look like this:
====================================================================
2018-07-20 17:15:48                                       1s elapsed
---- Requests ------------------------------------------------------
> Global                                       (OK=1      KO=0     )
> Get all users                                (OK=1      KO=0     )

---- Initial Scenario ----------------------------------------------
[##############################################################]100%
          waiting: 0      / active: 0      / done:1
====================================================================
Simulating Sateful (Session) Requests
A session in Gatling is basically a message that is exchanged between scenario steps, that are executed by Akka actors. It is a Map[String, Any] (where Any is similar to Object in Java). A session belongs to a virtual user, so that each user data is separated. You can add data to a session using feeders or extract values from requests.
Here is a sample of how to save session data:
exec(
  http("Get all users")
    .get("/users")
    .check(jsonPath("$[*]")
      .ofType[Map[String, Any]]
      .findAll
      .saveAs("users"))
)
To read data from the session, we can use expression language or session expression like this:
exec((session: Session) => {
  val usersMap = session("users").as[Vector[Map[String, Any]]]
  println("============ Sample user from list ============"
  println(usersMap(0))
  session
})
Changing load parameters
For now, we were using only one user. It’s time to change that and simulate some traffic. It’s done through injection, for example:
- Several users started at once — atOnceUsers
- Linear injection of number of users for some duration of time — rampUsers
- Users can be injected at a constant rate across time intervals, where the injection times are randomised — constantUsersPerSec
- Users can be injected from the starting rate to the target rate during intervals — rampUsersPerSec
Here we simulated two users starting, with three new ones showing up at random intervals. We ran the test for 3 minutes (3 minutes ignoring pauses; with added pauses on client machine, it took almost 5 minutes for the whole simulation to complete):
scn.inject(rampUsersPerSec(2) to(3) during(180 seconds) randomized)
Results
Right after running the simulation, we will see in the console some basic information about request count.
---- Default Scenario ----------------------------------------------
[##############################################################]100%
          waiting: 0      / active: 0      / done:422
====================================================================

====================================================================
---- Global Information --------------------------------------------
> request count                           4220 (OK=4220   KO=0     )
> min response time                         44 (OK=44     KO=-     )
> max response time                       4020 (OK=4020   KO=-     )
> mean response time                       168 (OK=168    KO=-     )
> std deviation                            255 (OK=255    KO=-     )
> response time 50th percentile             54 (OK=54     KO=-     )
> response time 75th percentile            265 (OK=265    KO=-     )
> response time 95th percentile            444 (OK=444    KO=-     )
> response time 99th percentile            713 (OK=713    KO=-     )
> mean requests/sec                     14.552 (OK=14.552 KO=-     )
---- Response Time Distribution ------------------------------------
> t < 800 ms                                          4184 ( 99%)
> 800 ms < t < 1200 ms                                  11 (  0%)
> t > 1200 ms                                           25 (  1%)
> failed                                                 0 (  0%)
====================================================================
There were 422 users. Each executed 10 requests. We can quickly spot if something went wrong. We can also see the distribution of response times in the response time ranges.
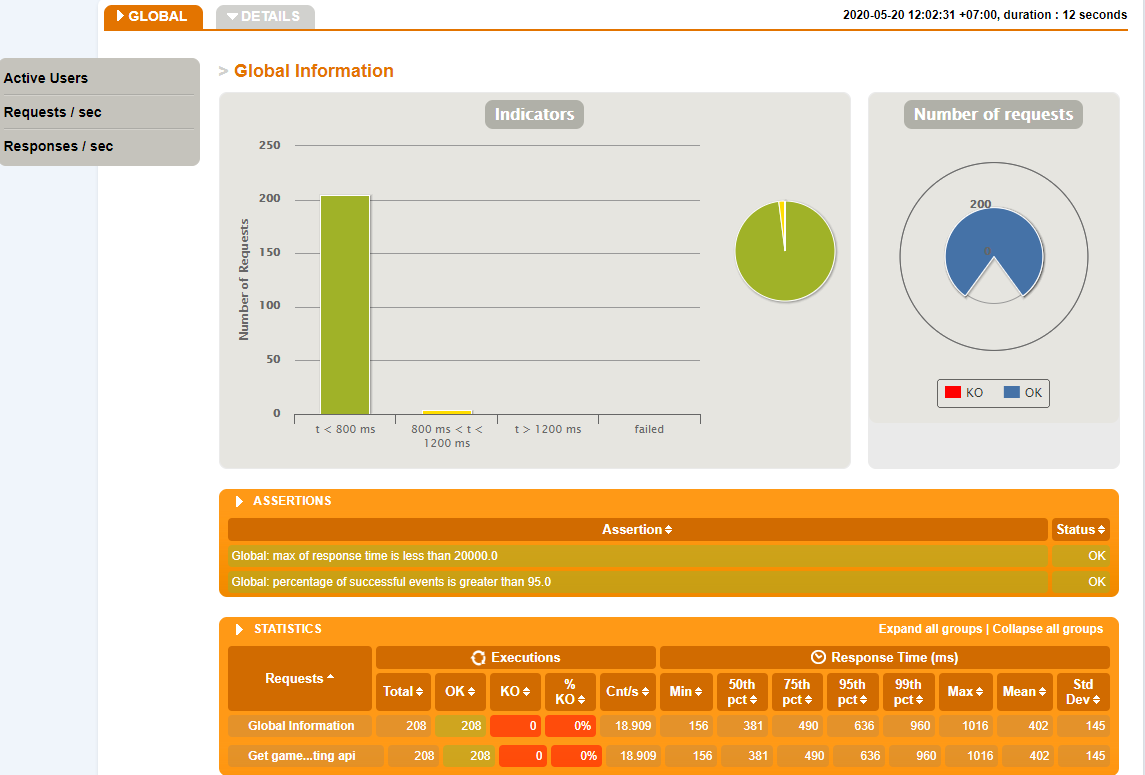
Gatling also generates an HTML report like following:

Here we can see more detailed information about response times. We can see that for 99% of users, the response time of Get all users was below 268ms. The minimum response time for this endpoint was 185ms, and the maximum was 507ms. We can also see charts for:
- Active Users along the Simulation
- Response Time Distribution
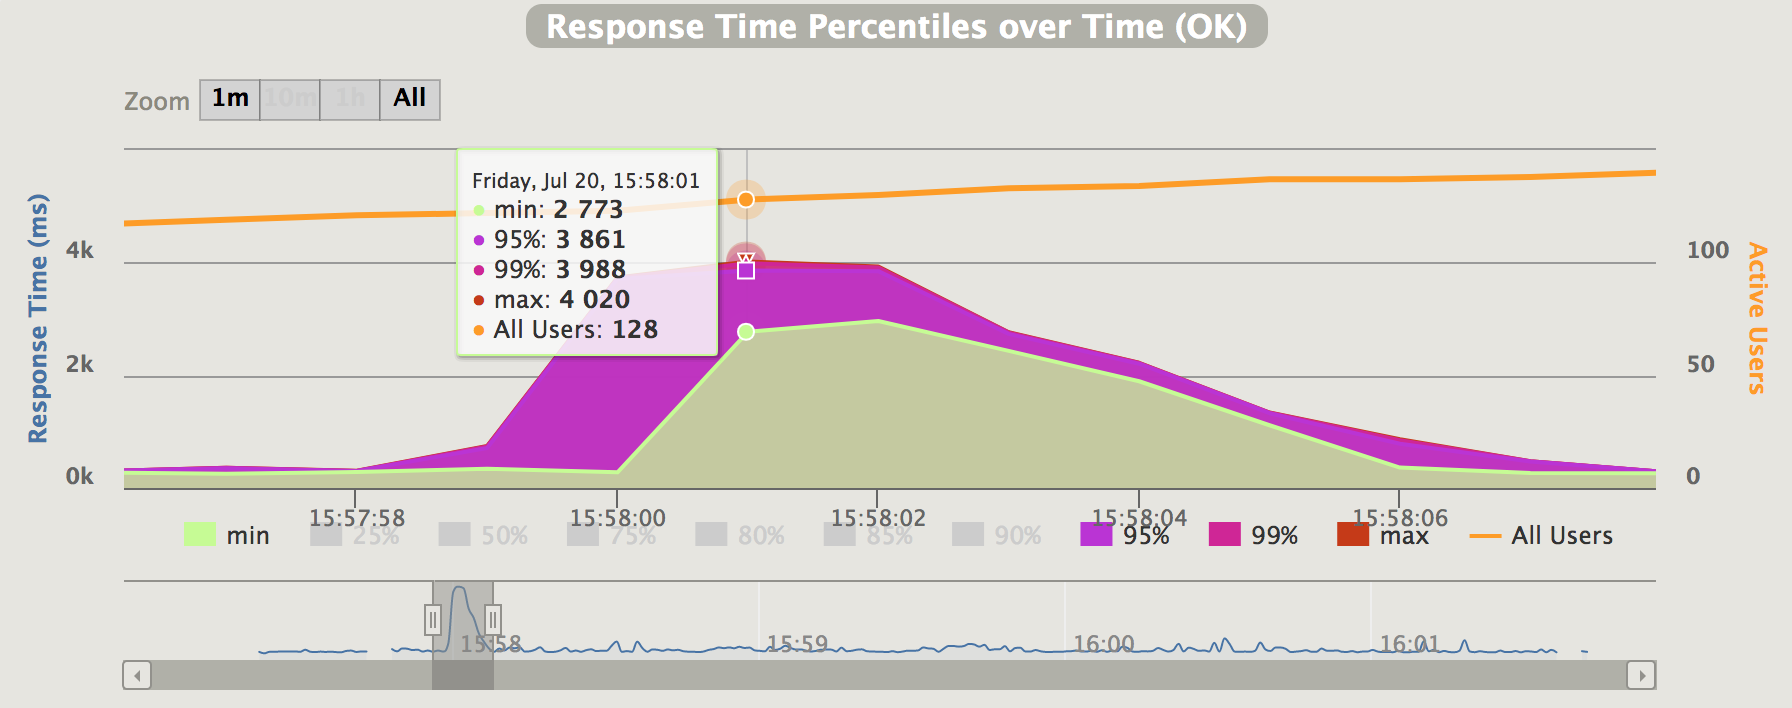
- Response Time Percentiles over Time (OK)
- Number of requests per second
There are also the charts that do not aggregate information for all requests. They allow us to view details of a specific request.

Now we can see that after 15:57:58, the response times started to degrade. This might be something worth looking into. It could be anything like a GC triggering on the server or any potential memory leak or things like this. The best part is that we can rerun the test and check if this behaviour persists and then fix those issues before going to production.
Conclusion
Gatling is a very impressive tool to assess your system capacity before going to production and allows developers and testers to fix scaling related issues beforehand. There are also a lot of features offered by Gatling to simulate more complicated and realistic scenarios which was not part of the experiment because of the sake of the simplicity.
Details can be found on the official Gatling documentation for further explorations.